Smart Youth Voters Shunned GOP in Midterms
 Republicans had a good election across most of the country, yet still lost heavily amongst young, highly educated voters.
Republicans had a good election across most of the country. Yet there are places where the Republicans lost ground - and in these places there are lessons to learn.
One such place is Tompkins county in western New York. In 2004, Democratic Senator Chuck Schumer carried Tompkins county by 43 points. This year, despite the Republican tide, Schumer increased his margin to 46 points. Schumer’s vote percentage in Tompkins in 2004 was four points below his statewide average. In 2010, his margin was 10 points above. Tompkins county's representative in the House, Democrat Maurice Hinchey received a whopping 80 percent of the vote.
Rural Tompkins county was not always so Democratic. It voted for Richard Nixon in 1960, 1968 and 1972, for Gerald Ford in 1976, and for Ronald Reagan in 1980. But over the past two decades, this former red state jurisdiction has gone deep blue.
What has changed in Tompkins county?
The answer is simple: Cornell University. A majority of Tompkins county voters are affiliated with Cornell. While Cornell has been there all along – almost as long as the Republican Party – and its students have made up a roughly constant share of plus/minus 20 per cent of the county’s population since 1960, their voting patterns have changed. How drastic is this development? How generalizable is it? How did it come about? And – perhaps most importantly – does it matter?
A few days before the election I encountered in FrumForum an exchange between Anne Applebaum and Jonah Goldberg.
Applebaum reacted to Christine O’Donnell’s advertised boast – “I didn’t go to Yale” – that Republicans “need to stop celebrating stupidity”. Goldberg’s response was, basically, that Republicans do not dislike elitism if it means academic excellence and hard work, but only the political program of leftist elites. Even on its own terms, Goldberg's response addressed only one half of the problem. For the question is not only whether Republicans dislike academic excellence and hard work; it is also whether intelligent people who study hard dislike Republicans.
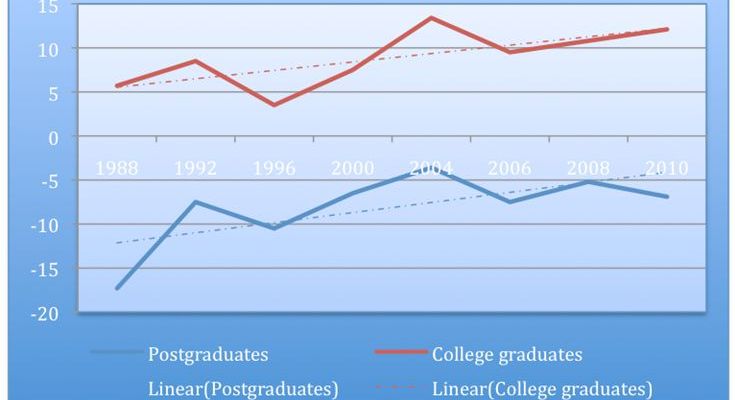
Exit polls began separating college graduates from people with postgraduate degrees in 1988. Looking at presidential elections, and adding the House elections in 2006 and 2010, the graph of college graduate voting looks like this. (A negative score means the Republicans do better among this group than they do on average, a positive score that the Democrats do better.)
There is a fairly linear trend, where Democrats now have improved their standing by 10.5 points among graduates and by 6.5 points among postgraduates. Still, Republicans do somewhat better among college graduates than they do on average. Based on these numbers alone, there is no cause for immediate alarm. To be sure, there is a trend that favors Democrats, but it is not dramatic.
However, to get a fuller picture of the trend, we will want to be more specific.
For example, we will want to separate new graduates: after all, the "college graduate" number includes people who graduated 40 and 50 years ago, whose voting behavior may be very different from more recent graduates.
And we will also want to disaggregate "college graduates." If we are interested in understanding academic elites, we want to find some way to do what the colleges themselves do: distinguish between higher-achieving and less-achieving students.
Tompkins county serves as a useful proxy for both of these more specific measures. Almost all Cornell graduates leave when they graduate. So the voting numbers for Tompkins county reflect the current student population, neatly separated from prior cohorts.
And as a county dominated by one elite school, Tompkins county enables us to study not students in general, but some of the very best students in the United States.
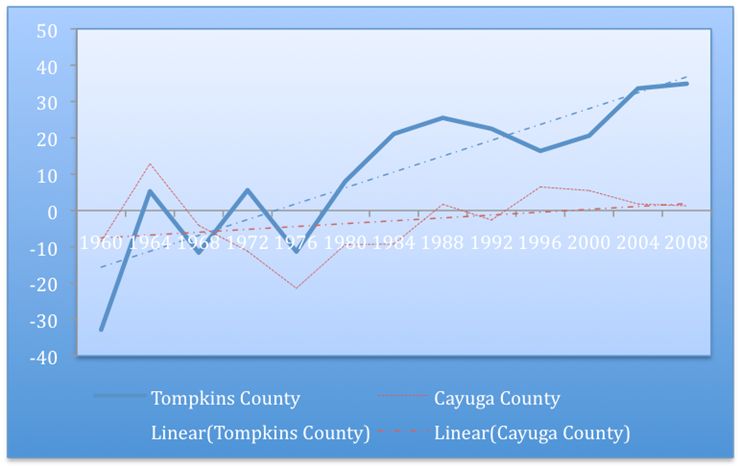
Now look at this next chart and compare it to the chart for college graduates generally.
The blue line is the trend for Tompkins county. Again, a negative score implies that Republicans do better than they do nationally, a positive score that the Democrats to better. In 1960 – admittedly an odd year – Nixon beat Kennedy by 33 points in what was nationally a tied election. In 2008 Obama beat McCain by 42 points, 35 points more than the national average. The trend is not quite linear – apart from the 1960 election, there is a relatively flat trend between 1964 and 1980 – on average, Republicans do a little bit better than Democrats relatively. Then there is a new level between 1984 and 2000, where Democrats are up by 20 points compared to the national average. Finally, there is a jump in the last two elections, with Democrats up around 35 points. This implies a swing of 40 points from the 1970s – and a whopping 68 points from 1960.
And even this second chart understates the Republican problem with top students.
While Cornell dominates the Tompkins county population to an unusual extent, it remains true that students are not the only people who live in Tompkins. Even adding professors and spouses and other academics affiliated somehow with the university, roughly half the Tompkins county population is not affiliated with Cornell.
Now take a look at this chart for neighboring Cayuga county, New York. With some clear exceptions for Goldwater and Carter, voting behavior in Cayuga looks pretty much like the national average. If the non-Cornell half of the population of Tompkins voted like Cayuga, as it probably did, the swing in the Cornell vote must have been much more extreme than our second chart suggests. The Cornell population must have started out more Republican leaning in the 1960s – and probably 85% Democratic today.
I repeated the exercise for Dartmouth College in Grafton county, New Hampshire. The results were similar – the raw numbers are less drastic, since Dartmouth students constitute a smaller share of the county population. And I did the same for a non-Ivy League university outside the Northeast, Indiana University at Bloomington, in Monroe county, which has comprised a large and fairly stable part of the county population. Again, the results are surprisingly similar: A 50 point swing in favor of Democrats, even as both the state of Indiana and in particular neighboring counties have trended Republican – though Indiana students probably have been somewhat more likely to vote Republican throughout. I’ve looked more cursorily at other counties with good universities that comprise a large share of the population. They all seem to confirm the trend, in all parts of the country. I’ve also looked at some large universities that are not as recognized for their academic excellence. Here, the trends are less dramatic, especially in the south.
This is part 1 in a series. Click here for part 2.


