More Bad News on Jobs
 A new set of labor statistics reveals that the nation's bout with unemployment may be even worse than suspected.
When it comes to economic conditions, I'm generally a glass-three-quarters-full kind of guy. Take unemployment. Quick—what was the risk in 2008 that an American worker would experience at least one bout of unemployment? Chances are you thought that that risk was higher than one in eight.* But figures from government surveys indeed suggest that thirteen out of fifteen workers (or would-be workers) had not a single day unemployed during the first year of the "Great Recession".** (Incidentally, the recessions of the mid-1970s and the early 1980s were also called the "Great Recession" by some commentators.)
The 2009 data won't be out until later in the year, but if last year ends up comparable to the depths of the early 1980s recession, then the average worker will "only" have had a seven in nine chance of avoiding unemployment.*** But these figures overstate economic risk because some unemployment is voluntary and much of it is brief. According to the Congressional Budget Office, the chance that a worker experienced an unemployment spell lasting more than two weeks during the three years from 2001 to 2003 was just one in thirteen—a period covering the last recession.
So as I've been following the debate about unemployment insurance and whether it actually worsens the unemployment rate, I've actually been open to the idea that being able to receive benefits for up to two years might create perverse incentives. The research is not as uniformly dismissive of the idea as some liberal assessments have implied (go to NBER's website and search the working papers for "unemployment" if you want to check this out yourself).
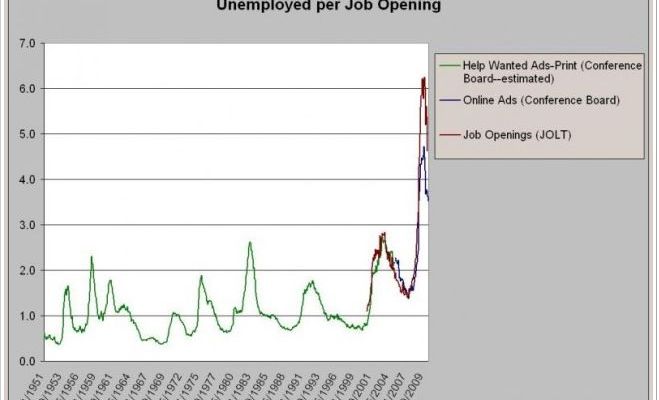
In particular, the idea that there were 5 people looking for work for every job opening struck me as sounding overly alarmist. So I started looking into the numbers to determine whether I thought they were reliable. The figures folks are using rely on a survey from the Bureau of Labor Statistics called the Job Openings and Labor Turnover Survey, which unfortunately only goes back to December of 2000. But the Conference Board has put out estimates of the number of help wanted ads since the 1950s. Through mid-2005, the estimates were based on print ads, as far as I can tell, but the Conference Board then switched to monitoring online ads. You can find the monthly figures for print ads here and the ones for online ads here. The JOLT and unemployment figures are relatively easy to find at BLS's website.
When I graphed the two Conference Board series (which requires some indexing to make them consistent--the print ad series being an index pegged to 1987 while the online series gives the actual number of ads) against the number of unemployed, and then the JOLT series against the unemployed, here's what I found:
I'll just say I was shocked and that I am much more sympathetic to extension of unemployment insurance than I was yesterday.
* * *
*The post originally said one in ten, which was wrong (the result of mistakenly using a figure I had computed for an older age range). Technically, the the figure was 13.2%, or 1 in 7.6.
** The original post said nine out of ten.
*** The original post said that if it reaches the depths of the 1990s recession, then the average worker will have had a five in six chance of unemployment. I located data for the early 1980s recession, which is a better comparison to the current one.
Cross-posted at The Empiricist Strikes Back.


