New Tool Makes the Cost of Tax Expenditures Clear
Many people believe that the deficit is large because of spending on expensive programs. This is why conservatives try to push for cuts in programs ranging from Medicare to the NPR, and why a politicians of any stripe can get elected on a rallying cry to end “waste, fraud, and abuse.” Yet politicians and public both are largely silent on a much more pernicious part of the tax code: tax expenditures and subsidies which distort the market and deprive the government of revenue. This is partly because information about how much revenue is lost through tax expenditures tends to be hard to access and difficult to interpret.
That is, until recently. The Pew Charitable Trusts has launched Subsidyscope, an online database that presents the estimates from both the Department of the Treasury and the Joint Committee on Taxation on the size of America’s tax expenditures.
What’s remarkable is that the value-added from the website is that it simply presents existing information, only more clearly. What becomes apparent from browsing the website is that the role of tax expenditures in distorting the American economy and shaping the federal budget is massive and largely unacknowledged.
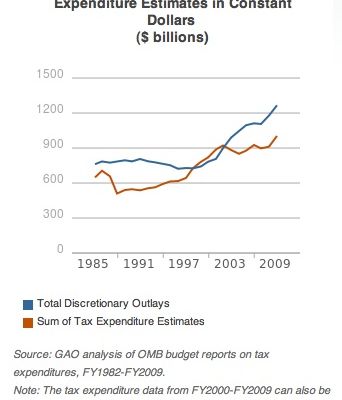
Here are a few interesting pieces of data to give a taste of some of the information available. Here is a chart comparing the size of US discretionary outlays with estimates for tax expenditures over time:
Just with a rough eyeball-estimate, expenditures appear to be almost as large as the outlays, give or take a couple hundred billion.
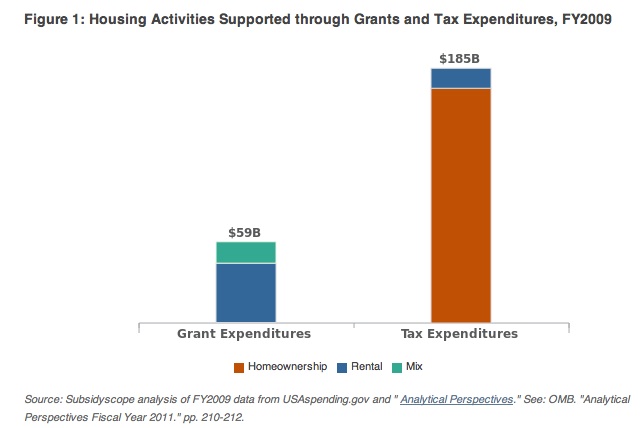
The site also particularly useful as presenting data about the subsidies in the housing sector. Home owning Americans benefit from the federal government’s housing policies yet many of them remain blissfully unaware of the scale of support they receive and what it costs in lost revenue. The government spends $244 billion on housing related grants and tax expenditures, more then any of the other sectors (Energy, Transportation, Health, etc.) that receive subsidies.
Here is a chart showing many tax expenditures are given to the housing sector:
It is important to state that simply removing these expenditures will not return all that revenue to the federal government. What would happen instead is that people will respond to the new incentives and may find other ways to keep their money, but there can be no doubt that Americas “housing policy” is just as large a drain on the long term solvency of the budget as are its entitlement programs.
With any luck, graphically laying this out can be a first step in making this clear.


